What’s exactly do Fibonacci numbers mean?
“A sequence in which each number is the sum of the two numbers that precede. It seems to be nature’s underlying principle behind life’s many events and phenomena.”

Leonardo Fibonacci also applied his life-inspired theory in conjunction with geometrical constructions. It is this marriage of concepts that continue to be used by traders to help them get better entries and take profit levels.
Let’s explain first how mathematically this works.
1, 1, 2, 3, 5, 8, 13, 21, 34, 55, 89, 144, …
We need to sum A+B = C after B+C = D and so on…
This sequence moves toward a certain constant irrational ratio, it represents a number with an endless, unpredictable sequence of decimal numbers, for the sake of brevity lets refer to it as 1.618…
1:1 = 1.0000, which is less than phi for 0.6180.
2:1 = 2.0000, which is more than phi for 0.3820.
3:2 = 1.5000, which is less than phi for 0.1180.
5:3 = 1.6667, which is more than phi for 0.0486.
8:5 = 1.6000, which is less than phi 0.0180.
As the Fibonacci sequence moves on, each new member will divide the next one, coming closer and closer to the unreachable phi. Fluctuations of the ratio around the value 1.618 for a lesser or greater value can also be seen when using the Elliott wave theory.
How this works:
It is a popular opinion that when correctly applied, the Fibonacci tools can successfully predict market behavior in 70% of cases, particularly when a specific price is predicted. Others consider computations for multiple retracements too time-consuming and difficult to use.
You’re lucky you don’t need to use complex math to find your trading ranges for the Fib strategies. #Gunbot will do all the hard work for you to properly calculate the fib retracements on the fly.
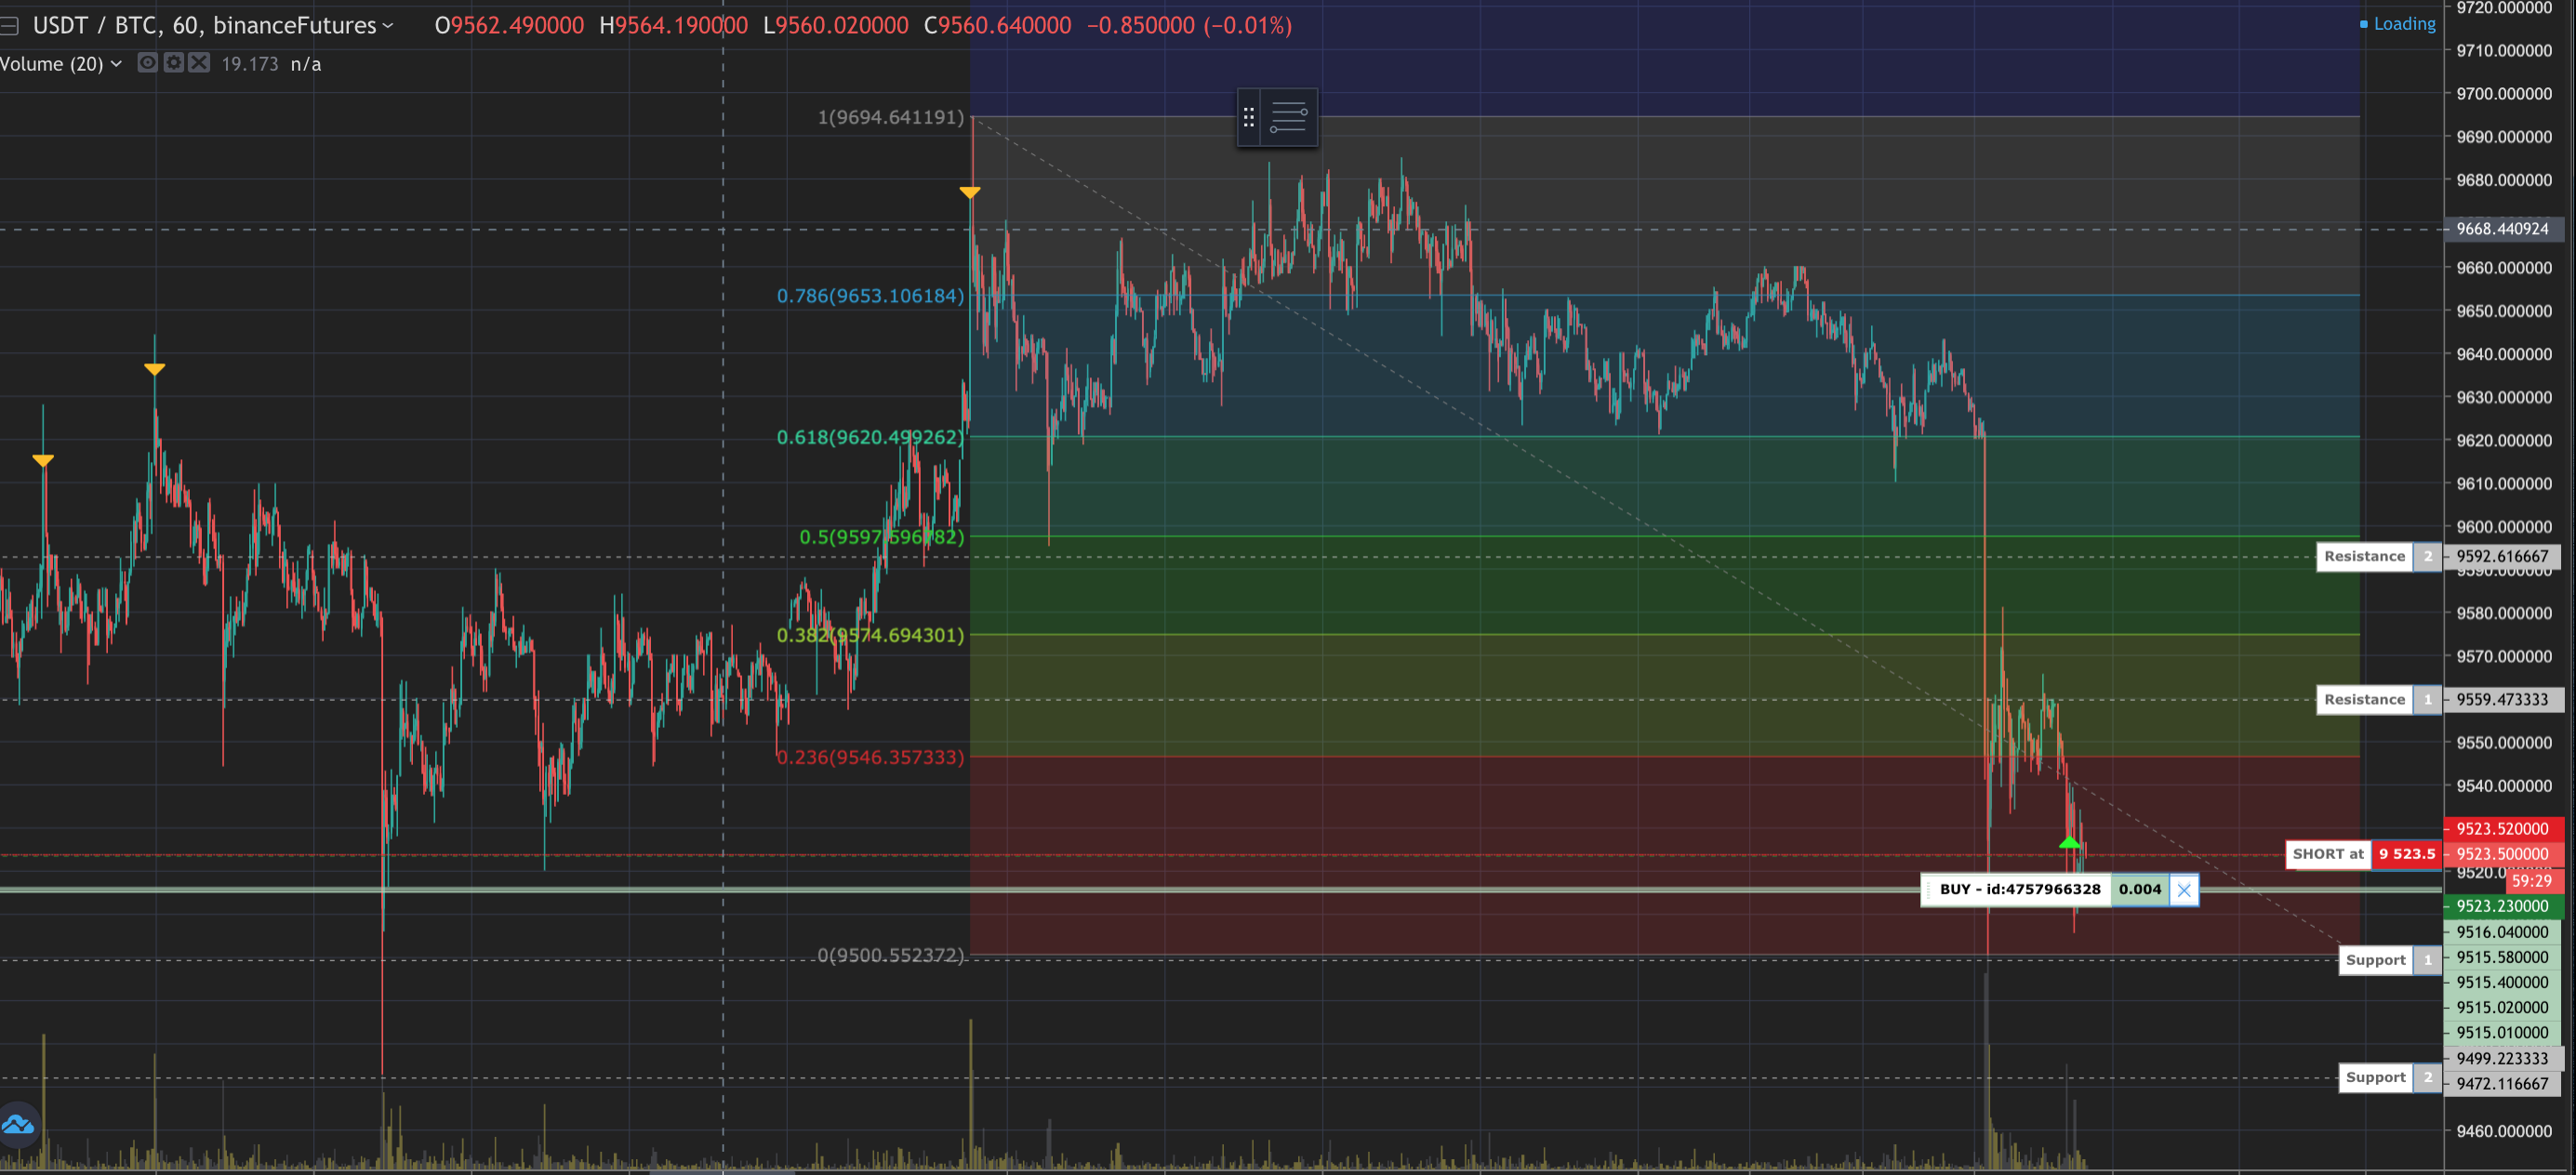
The GUI is also able to automatically draw fib retracements when the respective strategy is used, allowing you to see what #Gunbot sees. Example in the pic below:
The extension right of Fibonacci Retracements (it means how many candles behind we are taking into consideration to draw our Fibonacci chart) is given by the SMAPERIOD in the strategy.
For example, if you are using a chart on the 1-minute timeframe and you set SMAPERIOD 30, it will use last 30 minutes high/low candle data to draw the Fibonacci levels, notice we speak of candles, so if you change the period to 5 minutes and still use SMAPERIOD 30 it will use the last 150 minutes to calculate Fib levels. Change both parameters accordingly to your strategy to suit your trade style.
So you can use large time periods for swing trading or really short time periods for scalping the in/outs of the large timeframe.
SMAPERIOD value is critical because based on “what highest high and highest low” is taken into consideration Fib Retracements’ values will be different.
We have two kinds of entry points:
Normal swinging (good for scalping).
Breakout entry points.
Examples:
Swinging entry points:
When the price line goes below fib 1 (.236) and then goes back above, we long.
When the price line goes above fib 5 (.768) and then goes back below, we short.
Breakout entry points:
When the price line goes above fib 1 there is a breakout: we LONG.
When the price line goes below fib 0 there is a breakout: we SHORT.
When we close:
We can always use ROE and ROE_TRAILING as normally you commonly use in margin trading strategies in Gunbot or you can set a really unrealistic ROE and strategy bot will close following those rules:
1.- We are short and the price line goes below fib 1 (.236) we close the position at the lower fib 0.
2.- We are long and the price line goes above fib 5 (.768) we close position at higher fib 1.
3.- One of the above close orders fails because the price goes back, we cancel those orders and close at .236 and .768.
Risk Management in Fib Retracement is handled by DCA orders, so we can always average our entry to get a quicker / safer exit if the market goes against our entry.
We DCA using a % spread from our entry so if we are long and the price goes against us, the bot will DCA at the set % down our entry. It will automatically set another limit order with our configured TRADING_LIMIT. Same for shorts if the price goes against us, we will post a limit order to buy at % above our entry.
Strategy configuration:
Attention: apart from those specific parameters mentioned above, you need access to Market Maker to gain full access to all settings available.
Test it and play with the settings. Let us know what you think.
Trade safe and make sure you don’t overleverage!.